Mine development suffered in 2012 slowdown
INTIERRA-RMG: The 3,486 companies that make up the global mining industry had a combined market capitalisation of US$2,543 billion at the end of last year, for an average corporate valuation of some US$730 million.
This rather bland statistic hides, however, a huge variation in the structure of the industry.
On the final trading day of 2012 there were just 681 mining companies (20 per cent of the total) with individual market capitalisations of over US$100 million.
These companies were valued by the market at a combined US$2,501 billion (for an average market capitalisation of US$3.67 billion).
At the other extreme of the market, there were 1,756 companies (half of the total) that were each valued at less than US$10 million.
At the end of 2012 there were a further 817 companies valued at US$10 million to 49 million and 232 at US$50 million to 100 million (the latter companies had an average market capitalisation of US$71 million).
PROJECT PIPELINE
Last year saw a slow-down in the hitherto fast pace of mine development.
Investment in mining projects* grew 9 per cent in 2012 to US$735 billion, after the growth of 20 per cent in 2011.
However, the total number of projects in the pipeline fell 3 per cent to under 1,300 (similar to the level of 2010).
*Note: The requirement for inclusion in IntierraRMG’s Raw Materials Database (RMD) are that a project must have either an estimated mineral resource or an estimate of capital expenditure.
Several large projects have been put on hold, including BHP Billiton’s US$8 billion Olympic Dam expansion in Australia, and the Prioskolskoye iron-ore and Sukhoi Log gold projects in Russia.
A number of uranium and nickel projects have also been postponed.
Figures from RMD show that the average project has become more expensive.
This is attributed, especially, to an increase in the geological complexity of orebodies and to falling ore grades, making them more difficult to mine and beneficiate.
There has also been an increase in the construction of supporting infrastructure, and greater costs associated with securing environmental and community agreements.
The later project stages, for both greenfield and brownfield developments, have seen the greatest investment growth.
This is the result of mining companies pushing for early production to benefit from the still relatively high metals prices.
The early stage exploration projects have lost out, which might create pipeline problems in the future.
METALS CHOICE
RMD shows that the investment market last year continued to be dominated by three metals: iron ore, copper and gold.
Together these metals accounted for 77 per cent of the total project investment, amounting to US$570 billion.
Iron-ore prices have risen recently after a decline caused by concern over the Chinese economy, and the metal remained the most important investment target in 2012.
Annual spending increased 14 per cent to US$245 billion, leaving iron ore accounting for 33 per cent of the industry’s total metals investments.
However, the growth rate has fallen sharply compared with the 33 per cent jump in annual iron-ore investment in 2011.
The average investment on the almost 1,300 projects in 2012 (slightly down on the total number in 2011) rose 13 per cent (on a year-on-year basis) to US$1.2 billion.
Investment in copper projects grew 12 per cent last year (16 per cent in 2011), reaching US$200 billion.
The number of copper projects in the pipeline (which is similar to those recorded in 2011) was higher than for iron ore.
Stable production growth is forecast for the next two years.
Gold prices have remained robust during the recession but investment in gold projects is relatively low.
However, the physical number of projects remains very high at 410, representing one-third of the total number of mining projects recorded on RMD.
The number of nickel projects fell slightly in 2012, as did the total investment.
Nevertheless, production of the metal remained high despite the difficult market conditions.
This is attributed to the complication, and cost, of suspending advanced-stage nickel projects.
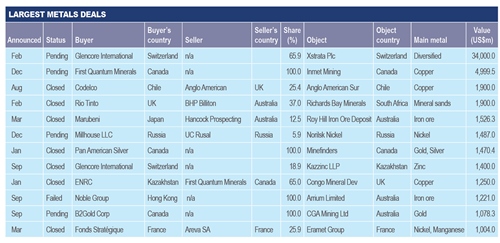
REDUCED NUMBER OF DEALS
Last year saw a sharp year-on-year drop in deal-making activity, with the total being down almost 20 per cent in value terms compared with 2011.
This decline was despite inclusion of the proposed merger between Glencore and Xstrata.
Although the number of announced deals was on a par with the previous year, the scarcity of ‘mega-deals’ (defined as being those valued at over US$1 billion) made for a significantly lower average deal value (the notable exception is, of course, the Glencore-Xstrata tie-up, which is still pending).
Copper, gold and iron ore were the most sought after metals, with the trio representing fully 76 per cent of the total deal evaluation in 2012 (excluding Glencore‑Xstrata).
Australia and Canada dominated deal-making last year, and, in terms of the number of deals that were announced, they accounted for almost half of the total.
China trailed behind, in third place.
While numerous, the Australian deals were smaller in value terms in 2012, compared with the previous year.
Switzerland ranked first due almost entirely to Glencore’s imminent acquisition of Xstrata, although there were also independent deals by both Glencore and Xstrata.
Indeed, Switzerland, Canada and China accounted for two thirds of the total deal-making activity last year (by value), and the top five countries together accounted for three quarters of the total activity.
Notable last year was China’s 60 per cent drop year-on-year in overseas deal-making.
While copper, gold and iron ore continued to be the focus of Chinese activity, both the number and value of these deals declined.